A CoreLogic analysis shows 41,000 foreclosures were completed in May 2015, a 19.2 percent year-over-year decline from 51,000 in May 2014. By comparison, before the decline in the housing market in 2007, completed foreclosures averaged 21,000 per month nationwide between 2000 and 2006.
...
Approximately 491,000 homes in the United States were in some stage of foreclosure as of May 2015, compared to 676,000 in May 2014, a decrease of 27.4 percent. This was the 43rd consecutive month with a year-over-year decline. As of May 2015, the foreclosure inventory represented 1.3 percent of all homes with a mortgage, compared to 1.7 percent in May 2014.
 Click on graph for larger image.
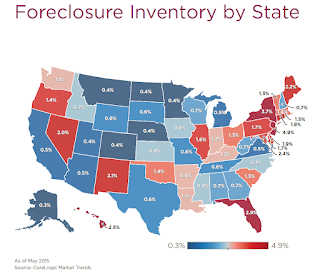
Here is a map from the May report that shows foreclosure inventory by state.
Some key "bubble" states - like Arizona and California - have mostly recovered.
Several judicial foreclosure states - like New Jersey and Florida - are still struggling.


