Other key indicators include the June ISM manufacturing index on Wednesday, June vehicle sales on June, and the April Case-Shiller house price index on Tuesday.
10:00 AM: Pending Home Sales Index for May. The consensus is for a 0.6% increase in the index.
10:30 AM: Dallas Fed Manufacturing Survey for June.
 9:00 AM: S&P/Case-Shiller House Price Index for April. Although this is the April report, it is really a 3 month average of February, March and April prices.
This graph shows the nominal seasonally adjusted National Index, Composite 10 and Composite 20 indexes through the March 2015 report (the Composite 20 was started in January 2000).
The consensus is for a 5.4% year-over-year increase in the Comp 20 index for April. The Zillow forecast is for the National Index to increase 4.0% year-over-year in April, and for prices to be unchanged month-to-month seasonally adjusted.
9:45 AM: Chicago Purchasing Managers Index for June. The consensus is for a reading of 50.6, up from 46.2 in May.
7:00 AM: The Mortgage Bankers Association (MBA) will release the results for the mortgage purchase applications index.
8:15 AM: The ADP Employment Report for June. This report is for private payrolls only (no government). The consensus is for 220,000 payroll jobs added in June, up from 200,000 in May.
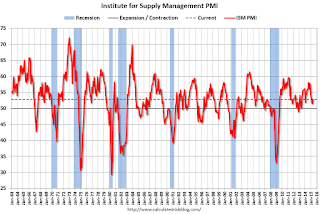
 10:00 AM: ISM Manufacturing Index for June. The consensus is for an increase to 53.2 from 52.8 in May.
Here is a long term graph of the ISM manufacturing index.
The ISM manufacturing index indicated expansion at 52.8% in May. The employment index was at 51.7%, and the new orders index was at 55.8%.
10:00 AM: Construction Spending for May. The consensus is for a 0.5% increase in construction spending.
 All day: Light vehicle sales for June. The consensus is for light vehicle sales to decrease to 17.2 million SAAR in June from 17.7 million in May (Seasonally Adjusted Annual Rate).
This graph shows light vehicle sales since the BEA started keeping data in 1967. The dashed line is the May sales rate.
8:30 AM: Employment Report for June. The consensus is for an increase of 228,000 non-farm payroll jobs added in June, down from the 280,000 non-farm payroll jobs added in May.
The consensus is for the unemployment rate to decrease to 5.4%.
 This graph shows the year-over-year change in total non-farm employment since 1968.
In May, the year-over-year change was almost 3.1 million jobs.
As always, a key will be the change in real wages - and as the unemployment rate falls, wage growth should pickup.
8:30 AM: The initial weekly unemployment claims report will be released. The consensus is for claims to decrease to 270 thousand from 271 thousand.
10:00 AM: Manufacturers' Shipments, Inventories and Orders (Factory Orders) for May. The consensus is a 0.3% decrease in orders.
All US markets will be closed in observance of the Independence Day weekend.


